The Launch
Launching is always a stressful experience. No matter how much preparation you do upfront, production traffic is going to throw you a curve ball. During the launch you want to have a 360º view of your systems so you can identify problems early and react quickly when the unexpected happens.
Your War Room: Monitoring the Launch
The metrics and instrumentation we discussed earlier will give you a high-level overview of what’s happening on your servers, but during the launch, you want finer-grained, real-time statistics of what’s happening within the individual pieces of your stack.
Based on the load testing you did earlier, you should know where hot spots might flare up. Setup your cockpit with specialized tools so you can watch these areas like a hawk when production traffic hits.
Server Resources
htop is like the traditional top process viewer on steroids. It can be
installed on Ubuntu systems with apt install htop.

Use htop to keep an eye on server-level metrics such as RAM and CPU usage. It
will show you which processes are using the most resources per server. htop
has a few other nifty tricks up its sleeve including the ability to:
send signals to running processes (useful for reloading uWSGI with a
SIGHUP)list open files for a process via
lsoftrace library and syscalls via
ltraceandstracerenice CPU intensive processes
What to Watch
Is the load average safe? During peak operation, it should not exceed the number of CPU cores.
Are any processes constantly using all of a CPU core? If so, can you split the process up across more workers to take advantage of multiple cores?
Is the server swapping (
Swp)? If so, add more RAM or reduce the number of running processes.Are any Python processes using excessive memory (greater than 300MB
RES)? If so, you may want to use a profiler to determine why.Are Varnish, your cache, and your database using lots of memory? That’s what you want. If they aren’t, double-check your configurations.
Varnish
Varnish is unique in that it doesn’t log to file by default. Instead, it comes bundled with a suite of tools that will give you all sorts of information about what it’s doing in realtime. The output of each of these tools can be filtered via tags1 and a special query language2 which you’ll see examples of below.
varnishstat
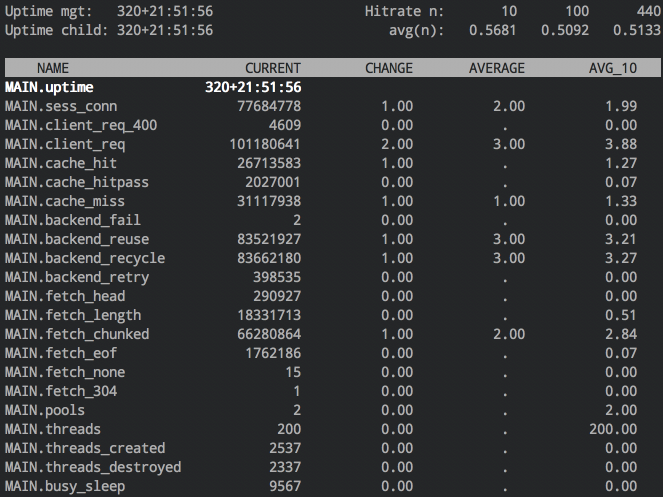
You’ll use varnishstat to see your current hit-rate and the cumulative counts
as well as ratios of different events, e.g. client connections, cache misses,
backend connection failures, etc.
Note
The hitrate displayed in the upper-right can be deceiving. A pass in
Varnish is not considered a cache miss, so the hitrate only measures the
percentage of requests served from the cache for requests that __can__ be
served from the cache. If you want a true measure of requests served out of
Varnish’s cache versus requests that are served from your backend, you’ll
need to take into account the s_pass value as well.
varnishhist
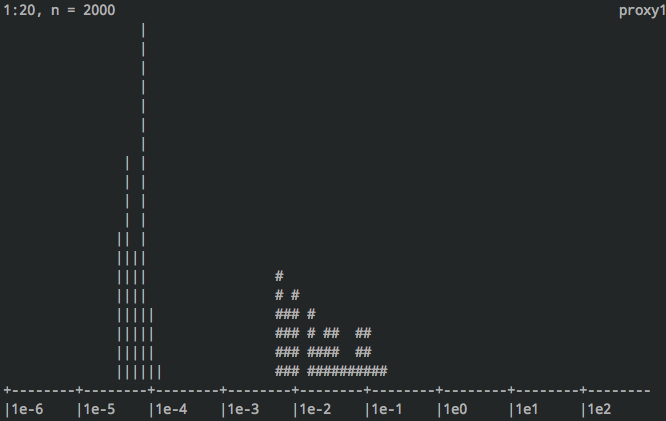
varnishhist is a neat tool that will create a histogram of response times.
Cache hits are displayed as a | and misses are #. The x-axis is the
time it took Varnish to process the request in logarithmic scale. 1e-3 is 1
millisecond while 1e0 is 1 second.
varnishtop
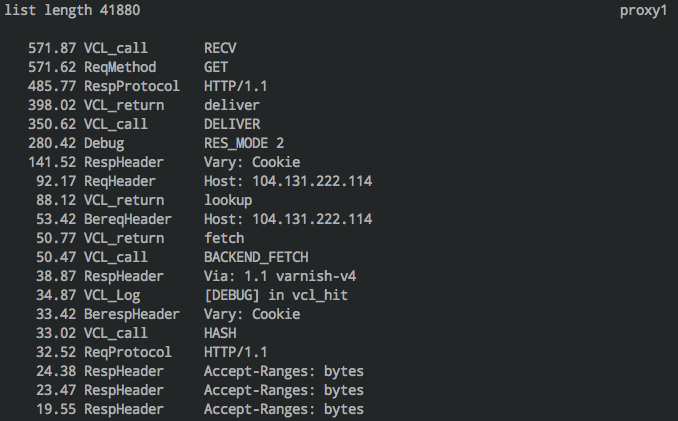
varnishtop is a continuously updated list of the most common log entries
with counts. This isn’t particularly useful until you add some filtering to the
results. Here’s a few incantations you might find handy:
varnishtop -b -i "BereqURL"Cache misses by URL – a good place to look for improving your hit ratevarnishtop -c -i "ReqURL"Cache hits by URLvarnishtop -i ReqMethodIncoming request methods, e.g. GET, POST, etc.varnishtop -c -i RespStatusResponse codes returned – sanity check that Varnish is not throwing errorsvarnishtop -I "ReqHeader:User-Agent"User agents
varnishlog
varnishlog is similar to tailing a standard log file. On it’s own, it will spew
everything from Varnish’s shared memory log, but you can filter it to see
exactly what you’re looking for. For example:
varnishlog -b -g request -q "BerespStatus eq 404" \-i "BerespStatus,BereqURL"A stream of URLs that came back as a 404 from the backend.
What to Watch
Is your hit rate acceptable? “Acceptable” varies widely depending on your workload. On a read-heavy site with mostly anonymous users, it’s feasible to attain a hit rate of 90% or better.
Are URLs you expect to be cached actually getting served from cache?
Are URLs that should not be cached, bypassing the cache?
What are the top URLs bypassing the cache? Can you tweak your VCL so they are cached?
Are there common 404s or permanent redirects you can catch in Varnish instead of Django?
uWSGI
uwsgitop shows statistics from your uWSGI process updated in realtime. It can
be installed with pip install uwsgitop and connect to the stats socket (see
uWSGI Tuning) of your uWSGI server via uwsgitop 127.0.0.1:1717.

It will show you, among other things:
number of requests served
average response time
bytes transferred
busy/idle status
Of course, you can also access the raw data directly to send to your metrics server:
uwsgi --connect-and-read 127.0.0.1:1717
What to Watch
Is the average response time acceptable (less than 1 second)? If not, you should look into optimizing at the Django level as described in The Build.
Are all the workers busy all the time? If there is still CPU and RAM to spare (htop will tell you that), you should add workers or threads. If there are no free resources, add more application servers or upgrade the resources available to them.
Celery
Celery provides both the inspect command3 to see point-in-time
snapshots of activity as well as the events command4 to see a realtime
stream of activity.
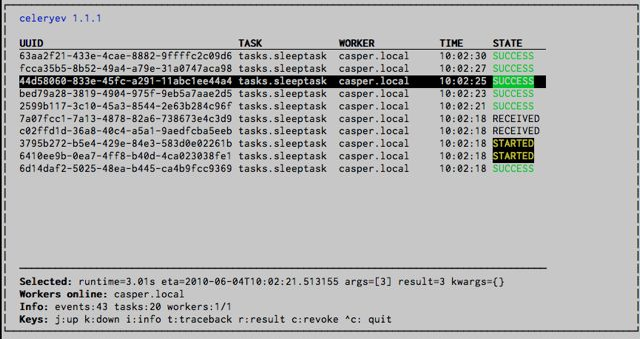
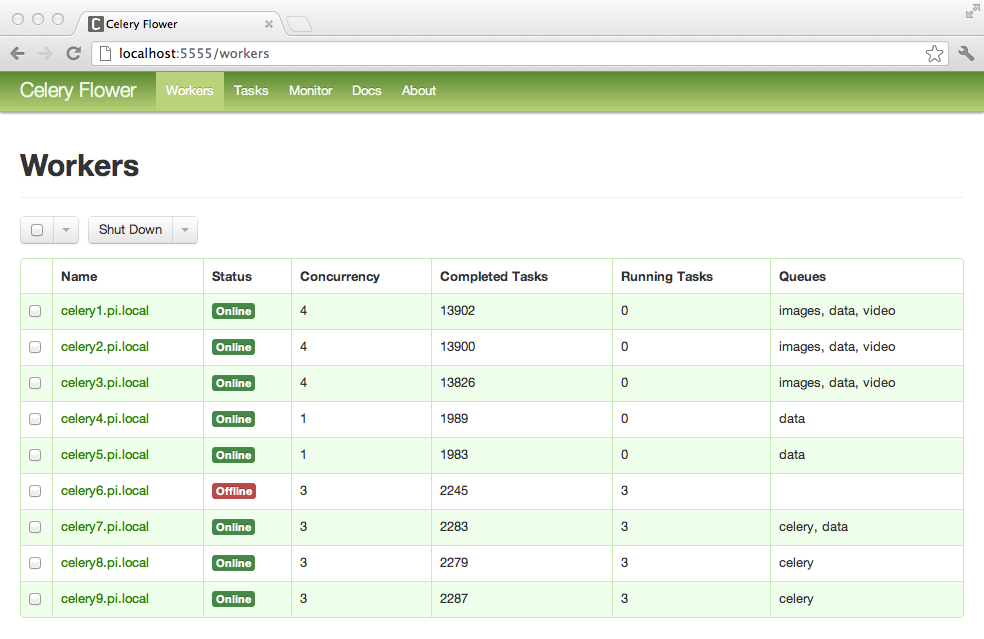
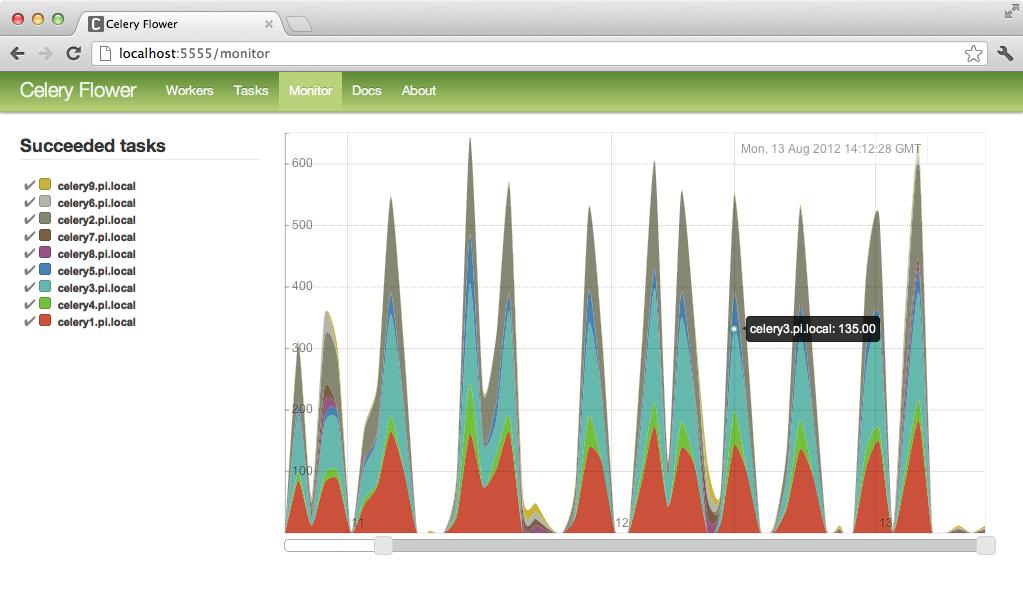
While both these tools are great in a pinch, Celery’s add-on web interface, flower5, offers more control and provides graphs to visualize what your queue is doing over time.
What to Watch
Are all tasks completing successfully?
Is the queue growing faster than the workers can process tasks? If your server has free resources, add Celery workers; if not, add another server to process tasks.
Memcached
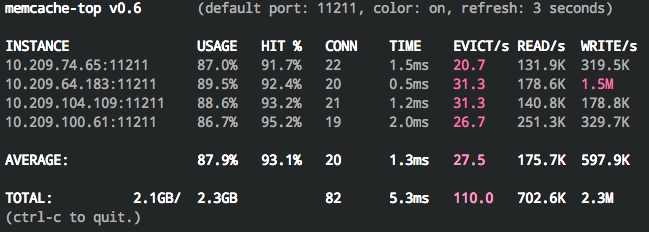
memcache-top6 will give you basic stats such as hit rate, evictions per
second, and read/writes per second.
It’s a single Perl script that can be downloaded and run without any other dependencies:
curl -L http://git.io/h85t > memcache-top
chmod +x memcache-top
Running it without any arguments will connect to a local memcached instance, or
you can pass the instances flag to connect to multiple remote instances:
./memcache-top --instances=10.0.0.1,10.0.0.2,10.0.0.3
What to Watch
How’s your hit rate? It should be in the nineties. If it isn’t, find out where you’re missing so you can take steps to improve. It could be due to a high eviction rate or poor caching strategy for your workflow.
Are connections and usage well balanced across the servers? If not, you’ll want to investigate a more efficient hashing algorithm, or modify the function that generates the cache keys.
Is the time spent per operation averaging less than 2ms? If not, you may be maxing out the hardware (swapping, network congestion, etc.). Adding additional servers or giving them more resources will help handle the load.
Database
pg_top
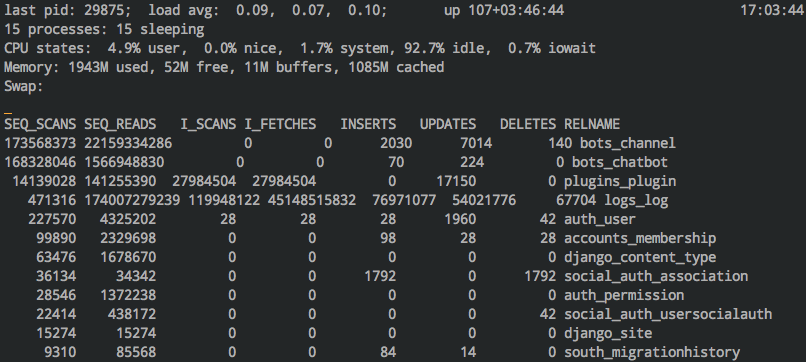
Monitor your Postgres database activity with pg_top. It can be installed
via apt install ptop (yes, ptop not pg_top) on Ubuntu. It not only
shows you statistics for the current query, but also per-table (press R)
and index (press X). Press E and type in the PID to explain a query in-
place. The easiest way to run it is as the postgres user on the same machine as
your database:
sudo -u postgres pg_top -d <your_database>
pg_stat_statements
On any recent version of Postgres, the pg_stat_statements extension 7
is a goldmine. On Ubuntu, it can be installed via
apt install postgresql-contrib. To turn it on, add the following line to
your postgresql.conf file:
shared_preload_libraries = 'pg_stat_statements'
Then create the extension in your database:
psql -c "CREATE extension pg_stat_statements;"
Once enabled, you can perform lookups like this to see which queries are the slowest or are consuming the most time overall.
SELECT
  calls,
  round((total_time/1000/60)::numeric, 2) as total_minutes,
  round((total_time/calls)::numeric, 2) as average_ms,
  query
FROM pg_stat_statements
ORDER BY 2 DESC
LIMIT 100;
The best part is that it will normalize the queries, basically squashing out the variables and making the output much more useful.
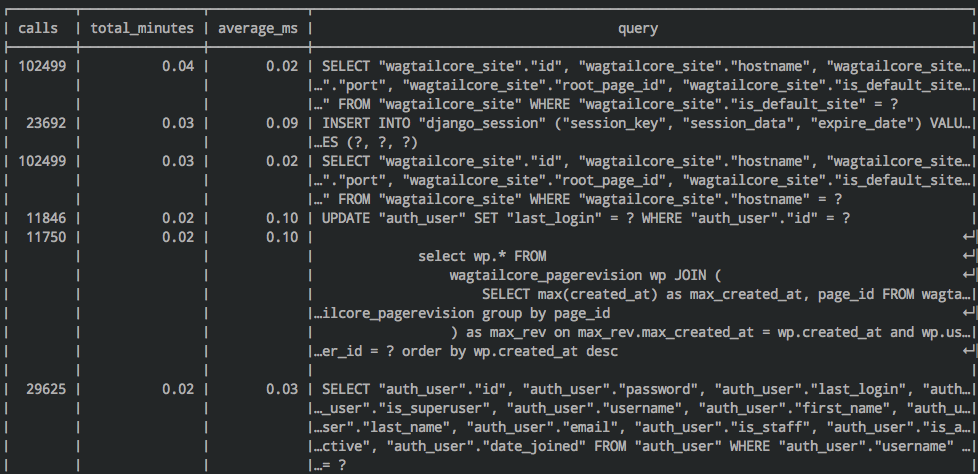
The Postgres client’s output can be a bit hard to read by default. For line wrapping and a few other niceties, start it with the following flags:
psql -P border=2 -P format=wrapped -P linestyle=unicode
For MySQL users, pt-query-digest8 from the Percona Toolkit will give
you similar information.
pgBadger
While it won’t give you realtime information, it’s worth mentioning
pgBadger9 here. If you prefer graphical interfaces or need more detail
than what pg_stat_statements gives you, pgBadger has your back. You can use
it to build pretty HTML reports of your query logs offline.
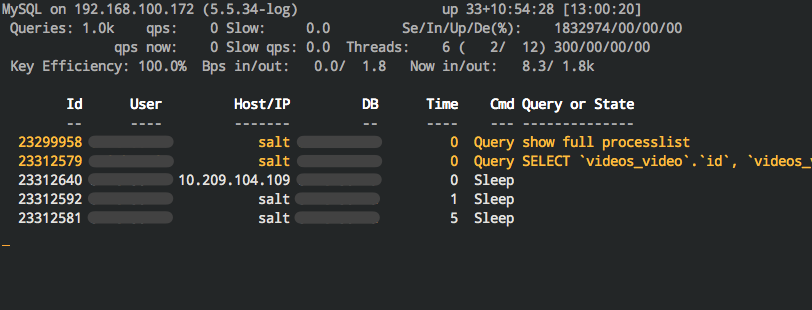
mytop
The MySQL counterpart to pg_top is mytop. It can be installed with
apt install mytop on Ubuntu. Use e and the query ID to explain it
in-place.
Tip
Since disks are often the bottleneck for databases, you’ll also want
to look at your iowait time. You can see this via top as X%wa in the
Cpu(s) row. This will tell you how much CPU time is spent waiting for
disks. You want it to be zero or very close to it.
What to Watch
Make sure the number of connections is well under the maximum connections you’ve configured. If not, bump up the maximum, investigate if that many connections are actually needed, or look into a connection pooler.
Watch out for “Idle in transaction” connections. If you do see them, they should go away quickly. If they hang around, one of the applications accessing your database might be leaking connections.
Are queries running for more than a second? They could be waiting on a lock or require some optimization. Make sure your database isn’t tied up working on these queries for too long.
Check for query patterns that are frequently displayed. Could they be cached or optimized away?
When Disaster Strikes
Despite all your preparation, it’s very possible your systems simply won’t keep up with real world traffic. Response times will sky rocket, tying up all available uWSGI workers and requests will start timing out at the load balancer or web accelerator level. If you are unlucky enough to experience this, chances are good that either your application servers, database servers, or both are bogging down under excessive load. In these cases, you want to look for the quickest fix possible. Don’t rule out throwing more CPUs at the problem for a short-term band-aid. Cloud servers cost pennies per hour and can get you out of a bind while you look for longer term optimizations.
Application Server Overload
If the load is spiking on your application servers but the database is still humming along, the quickest remedy is to simply add more application servers to the pool (scaling horizontally). It will ease the congestion by spreading load across more CPUs. Keep in mind this will push more load down to your database, but hopefully it still has cycles to spare.
Once you have enough servers to bring load back down to a comfortable level, you’ll want to use your low-level toolkit to determine why they were needed. One possibility is a low cache hit rate on your web accelerators.
Note
We had a launch that looked exactly like this. We flipped the switch to the new servers and watched as load quickly increased on the application layer. This was expected as the caches warmed up, but the load never turned the corner, it just kept increasing. We expected the need for three application servers, launched with four, but ended up scaling to eight to keep up with the traffic. This was well outside of our initial estimates so we knew there was a problem.
We discovered that the production web accelerators weren’t functioning properly and made adjustments to fix the issue. This let us drop three application servers out of the pool, but it was still more than we expected. Next we looked at which Django views were consuming the most time. It turned out the views that calculated redirects for legacy URLs were not only very resource intensive, but, as expected, getting heavy traffic during the launch. Since these redirects never changed, we added a line in Varnish to cache the responses for one year.
With this and a few more minor optimizations, we were able to drop back down to our initially planned three servers, humming along at only 20% CPU utilization during normal operation.
Database Server Overload
Database overload is a little more concerning because it isn’t as simple to scale out horizontally. If your site is read-heavy, adding a replica (see Read-only Replicas) can still be a relatively simple fix to buy some time for troubleshooting. In this scenario, you’ll want to review the steps we took in Database Optimization and see if there’s anything you missed earlier that you can apply to your production install.
Note
We deployed a major rewrite for a client that exhibited pathological performance on the production database at launch. None of the other environments exhibited this behavior. After a couple of dead-end leads, we reviewed the slow query log of the database server. One particular query stood out that was extremely simple, but ate up the bulk of the database’s processing power. It looked something like:
SELECT ... FROM app_table WHERE fk_id=X
EXPLAIN told us we weren’t using an index to do the lookup, so it was
searching the massive table in memory. A review of the table indexes showed
that the foreign key referenced in the WHERE clause was absent.
The culprit was an incorrectly applied database migration that happened long before the feature actually launched, which explained why we didn’t see it in the other environments. A single SQL command to manually add the index immediately dropped the database load to almost zero.
Application & Database Server Overload
If both your application and database are on fire, you may have more of a challenge on your hands. Adding more application servers is only going to exacerbate the situation with your database. There are two ways to attack this problem.
You can start from the bottom up and look to optimize your database. Alleviating pressure on your database will typically make your application more performant and relieve pressure there as well.
Alternatively, if you can take pressure off your application servers by tuning your web accelerator, it will trickle down to the database and save you cycles there as well.
Note
A while back, we launched a rewrite for a very high traffic CMS, then watched as the load skyrocketed across the entire infrastructure. We had done plenty of load testing so the behavior certainly took us by surprise.
We focused on the load on the primary database server, hoping a resolution there would
trickle up the stack. While watching mytop we noticed some queries that
weren’t coming from the Django stack. An external application was running
queries against the same database. This was expected, but its traffic was so
low nobody expected it to make a dent in the beefy database server’s resources.
It turned out that it triggered a number of long-running queries that tied up
the database, bringing the Django application to its knees. Once we
identified the cause, the solution was simple. The external application only
needed read access to the database, so we pointed it to a replica database. It
immediately dropped the load on the master database and gave us the breathing
room to focus on longer-term optimizations.
Once you’ve weathered the storm of the launch, it’s time to let out a big sigh of relief. The hardest work is behind you, but that doesn’t mean your job is done. In the next chapter, we’ll discuss maintaining your site and making sure it doesn’t fall into disrepair.